Make Impact: Creative Poster & Graphical Design Course
DSC workshop
- Date
- 22 March 2024
- Time
- 09:00 -17:00
- Room
- B3.07 & B3.08

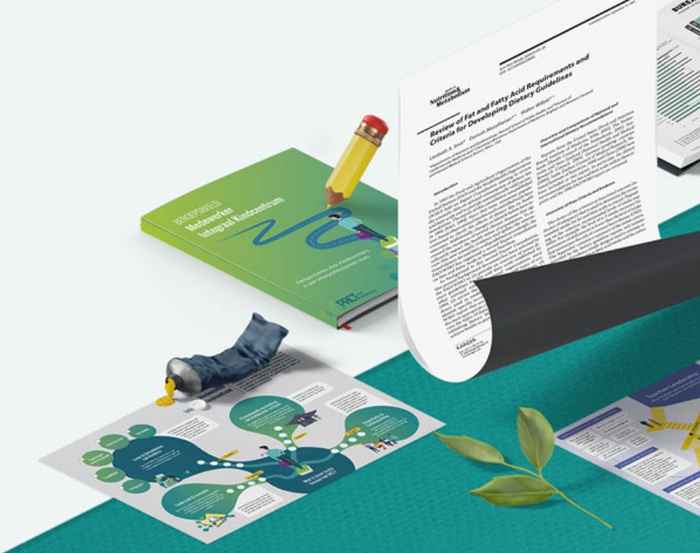
This workshop is the starting point for your design skills. Learn the essentials of good design, how to avoid common design mistakes and how to create user-friendly and clear designs that get your message across. The workshop is in English.
Programme:
Morning session: 09:00 - 12:00
The morning programme consists of a crash-course in design. You will learn about design principles, tools and resources and data visualisation techniques that you can apply in any programme or application of your choice. Everybody who is interested in the basics of design is welcome. Maximum number of participants: 40.
Afternoon workshop: 12:00 - 17:00
Are you interested in already applying your newy acquired design knowledge? Then join the afternoon programme too! You will be guided to create your own conference poster or graphic abstract of your research. You will receive personal feedback and help to translate your goals into visual impact. At the end of the day, you will have a design that you can use for your own purposes. Maximum number of participants: 15.
All afternoon participants must also attend the morning programme.
Learning goals
- Create a compelling title to convey your message
- Learn design principles to create clear designs. Hierarchy, contrast, emphasis, colors, consistency and white space
- Examples of good and bad posters, presentations, visual summaries and infographics
- How to effectively incorporate images and icons into diagrams
- Overview of tools and resources you can use for your work
- Data visualization: learn how to create better charts and other forms of data visualization
- Accessibility and creating inclusive designs
Workshop instructor
Liesbeth Smit, co-founder and trainer at The Online Scientist
Practical information
For this workshop no prior knowledge or experience is required. Please note that if you want to attend the afternoon workshop, you also need to join the morning programme.
What to bring (afternoon programme only): Laptop and charger, and a first version (or the text and contents) of your poster/graphical abstract to work with.
The afternoon workshop includes a free lunch for afternoon participants. Due to the university policy to reduce waste, you will have to bring your own cup for beverages.
Registration:
This workshop is free of charge. Researchers and Masters students are welcome to apply, with preference given to DSC Affiliate members.
In case of over-registration, a selection will be made based on background and motivation. You will be notified by March 18 whether your participation is definite.
